Python如何实现图像转换?本文带你了解如何使用 Python 中的 OpenCV 库执行透视图像转换技术,例如图像平移、反射、旋转、缩放、剪切和裁剪。
Python OpenCV实现图像转换介绍
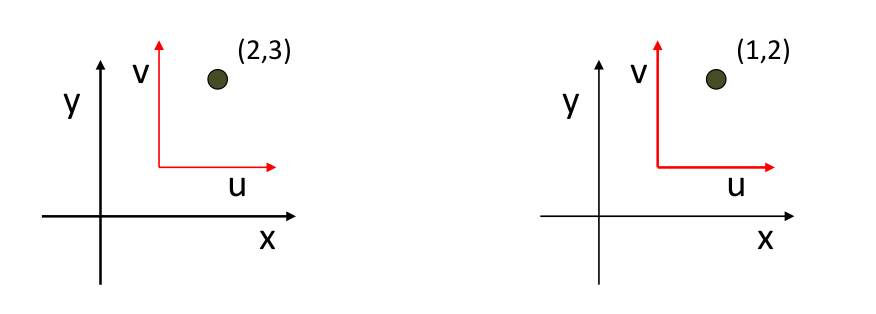
图像变换是一种坐标变换函数,它将一个坐标系中的一些(x,y)点映射到另一个坐标系中的点(x',y')。
 例如,如果我们在xy坐标中有(2, 3)个点,而我们在uv坐标中绘制同一个点,同一个点的表示方式不同,如下图所示:
这是Python图像转换示例目录:
- 图像变换的使用
- 图像平移
- 图像缩放
- 图像剪切
- 在 x 轴方向上剪切
- y 轴方向的剪切
- 图像反射
- 图像旋转
- 图像裁剪
- 结论
图像变换的使用
在下图中,漫画书与右侧图像之间的几何关系基于相似变换(旋转、平移和缩放)。如果我们需要训练一个机器学习模型来找到这本漫画书,那么我们需要输入不同形状和角度的图像。
图像转换技术在机器学习中图像的预处理阶段可以帮助我们很多。
矩阵可以表示图像。矩阵中的每个值都是特定坐标处的像素值。可以使用矩阵乘法来执行图像变换。数学家已经计算出一些矩阵,可以用来完成某些转换操作。
平移
Python OpenCV实现图像转换:图像平移是图像从一个位置到另一个位置的直线平移,因此物体的平移称为平移。下面显示的矩阵用于图像的平移:
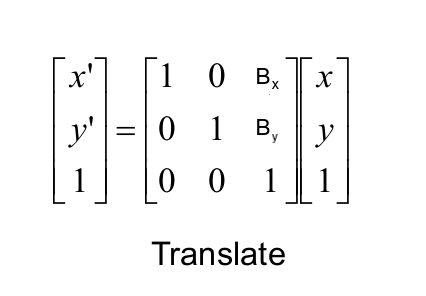 b x的值 定义了图像在 x 轴上的移动量,而b y 的值 决定了图像在 y 轴上的移动:
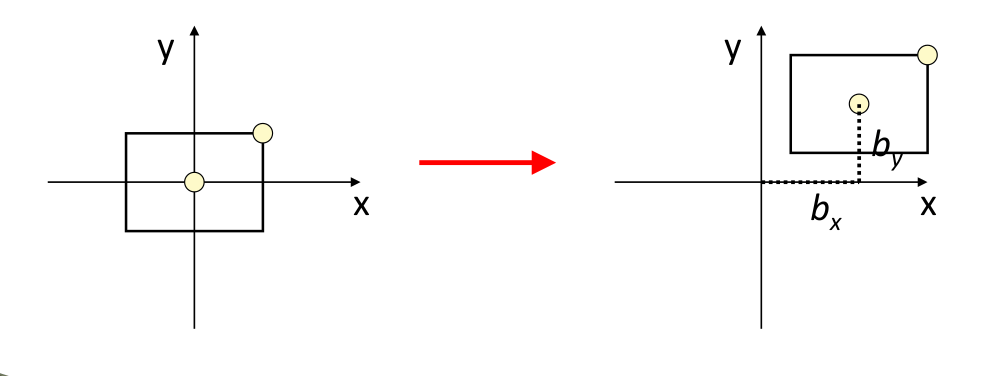 现在你了解了图像平移,让我们看一下 Python 代码。在 OpenCV 中,有两个用于执行转换的内置函数:
cv2.warpPerspective: 将(3x3)变换矩阵作为输入。cv2.warpAffine: 将(2x3)变换矩阵作为输入。
这两个函数都采用三个输入参数:
- 输入图像。
- 变换矩阵。
- 图像的高度和宽度的元组。
在本教程中,我们将使用cv2.warpPerspective()函数。
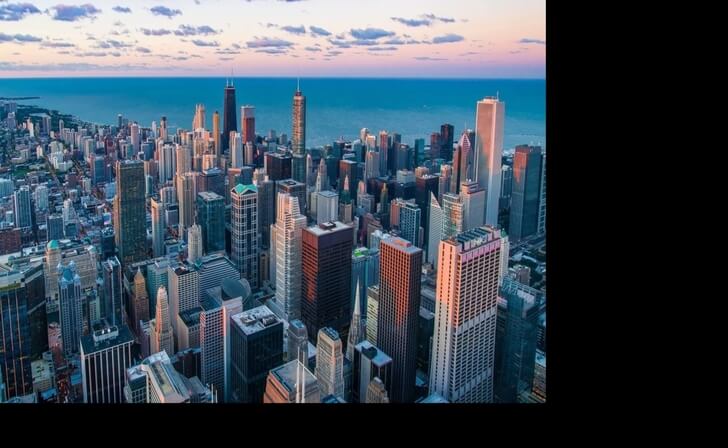
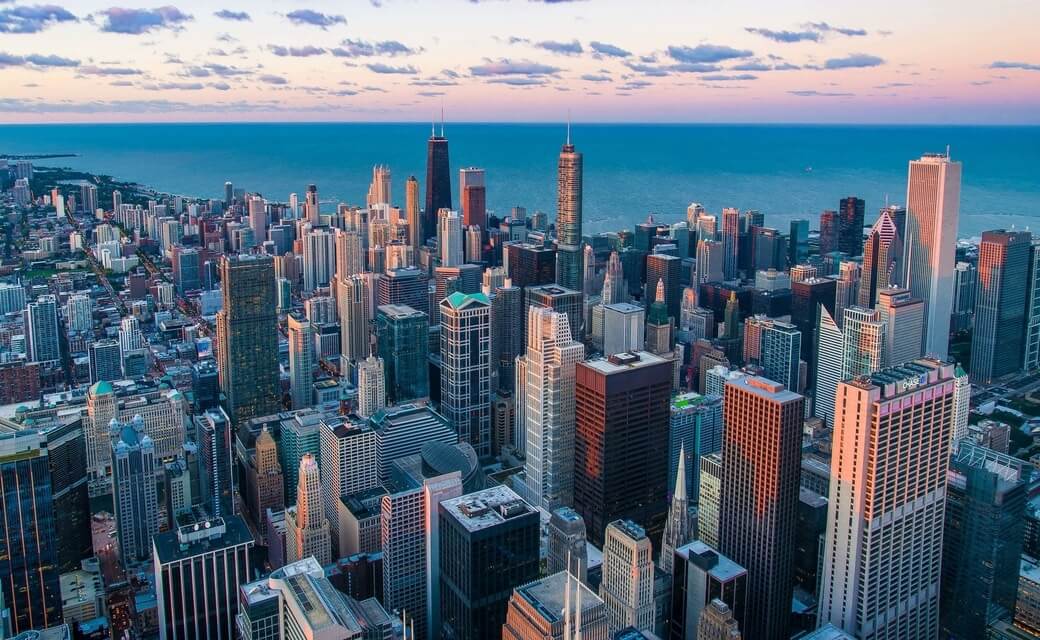
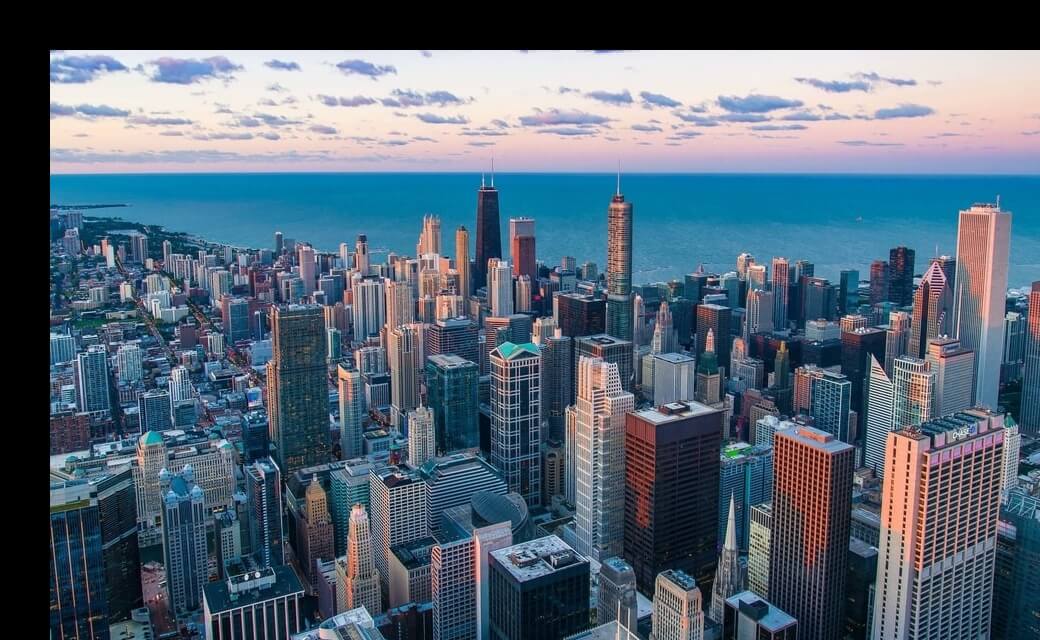
Python如何实现图像转换?下面的代码读取输入图像(如果你想要确切的输出,请在此处获取演示图像并将其放在当前工作目录中),对其进行平移并显示:
import numpy as np
import cv2
import matplotlib.pyplot as plt

# read the input image
img = cv2.imread("city.jpg")
# convert from BGR to RGB so we can plot using matplotlib
img = cv2.cvtColor(img, cv2.COLOR_BGR2RGB)
# disable x & y axis
plt.axis('off')
# show the image
plt.imshow(img)
plt.show()
# get the image shape
rows, cols, dim = img.shape
# transformation matrix for translation
M = np.float32([[1, 0, 50],
                [0, 1, 50],
                [0, 0, 1]])
# apply a perspective transformation to the image
translated_img = cv2.warpPerspective(img, M, (cols, rows))
# disable x & y axis
plt.axis('off')
# show the resulting image
plt.imshow(translated_img)
plt.show()
# save the resulting image to disk
plt.imsave("city_translated.jpg", translated_img)请注意,我们使用plt.axis('off')as 我们不想输出轴值,我们使用 matplotlib 的imshow()函数显示图像。
我们还使用plt.imsave()函数将图像保存在本地。原图:
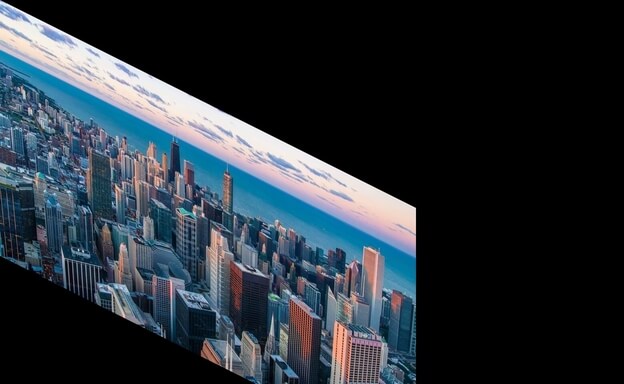
翻译图像:
 图像缩放
图像缩放
Python OpenCV实现图像转换:图像缩放是用于调整数字图像大小的过程。OpenCV 有一个内置函数cv2.resize(),但我们将像以前一样使用矩阵乘法来执行转换。用于缩放的矩阵如下所示: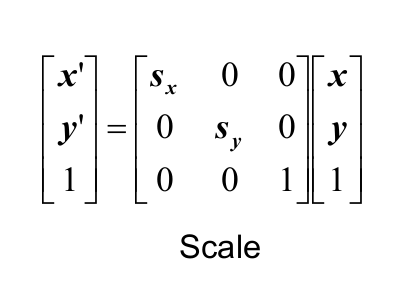 S x和S y分别是 x 轴和 y 轴的缩放因子。
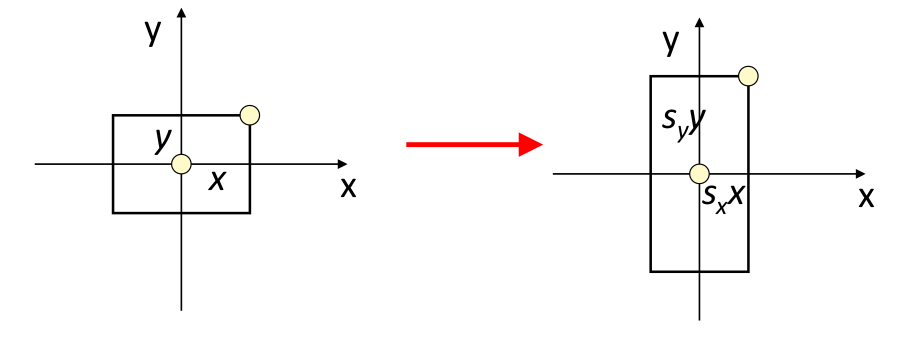 下面的代码负责读取相同的图像,定义用于缩放的变换矩阵,并显示结果图像:
import numpy as np
import cv2
import matplotlib.pyplot as plt

# read the input image
img = cv2.imread("city.jpg")
# convert from BGR to RGB so we can plot using matplotlib
img = cv2.cvtColor(img, cv2.COLOR_BGR2RGB)
# disable x & y axis
plt.axis('off')
# show the image
plt.imshow(img)
plt.show()
# get the image shape
rows, cols, dim = img.shape
#transformation matrix for Scaling
M = np.float32([[1.5, 0  , 0],
            	[0,   1.8, 0],
            	[0,   0,   1]])
# apply a perspective transformation to the image
scaled_img = cv2.warpPerspective(img,M,(cols*2,rows*2))
# disable x & y axis
plt.axis('off')
# show the resulting image
plt.imshow(scaled_img)
plt.show()
# save the resulting image to disk
plt.imsave("city_scaled.jpg", scaled_img)
输出图像:
请注意,你可以使用cropping轻松删除那些黑色像素,我们将在本教程的末尾介绍这一点。
另请阅读:如何在 Python 中使用 OpenCV 模糊图像中的人脸。
Python图像转换示例:图像剪切
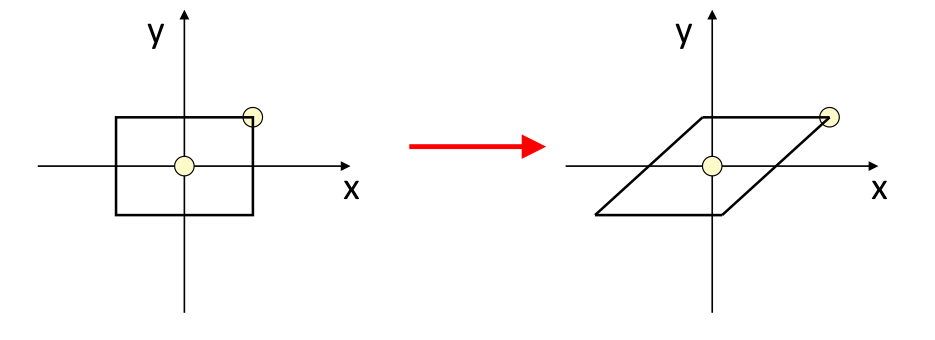
剪切映射是一种将每个点在固定方向上位移的线性映射,它用与其 x 或 y 坐标成正比的特定值水平或垂直替换每个点,有两种类型的剪切效应。
在 x 轴方向上剪切
在 x 轴方向上进行剪切时,与 x 轴平行的图像边界保持其位置,而与 y 轴平行的边缘根据剪切因子改变其位置:
y 轴方向的剪切
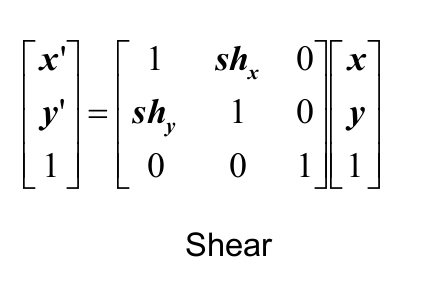
Python如何实现图像转换?在 y 轴方向上进行剪切时,与 y 轴平行的图像边界保持其位置,而与 x 轴平行的边缘根据剪切因子改变其位置。剪切矩阵如下图所示:
 下面是负责剪切的代码:
import numpy as np
import cv2
import matplotlib.pyplot as plt

# read the input image
img = cv2.imread("city.jpg")
# convert from BGR to RGB so we can plot using matplotlib
img = cv2.cvtColor(img, cv2.COLOR_BGR2RGB)
# disable x & y axis
plt.axis('off')
# show the image
plt.imshow(img)
plt.show()
# get the image shape
rows, cols, dim = img.shape
# transformation matrix for Shearing
# shearing applied to x-axis
M = np.float32([[1, 0.5, 0],
             	[0, 1  , 0],
            	[0, 0  , 1]])
# shearing applied to y-axis
# M = np.float32([[1,   0, 0],
#             	  [0.5, 1, 0],
#             	  [0,   0, 1]])
# apply a perspective transformation to the image
sheared_img = cv2.warpPerspective(img,M,(int(cols*1.5),int(rows*1.5)))
# disable x & y axis
plt.axis('off')
# show the resulting image
plt.imshow(sheared_img)
plt.show()
# save the resulting image to disk
plt.imsave("city_sheared.jpg", sheared_img)
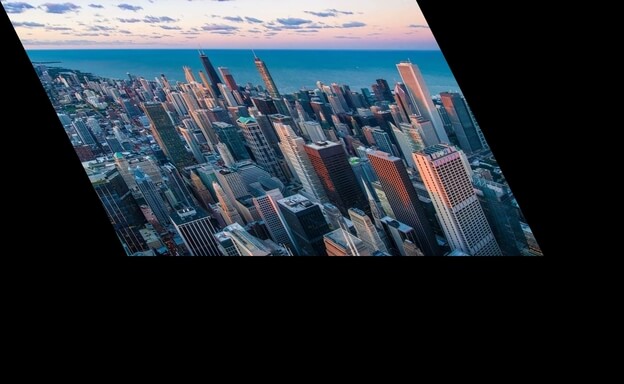
第一个矩阵是应用于 x 轴的剪切,如果你想要 y 轴,则注释第一个矩阵并取消注释第二个矩阵。
X轴剪切图像:
Y轴剪切图像:
相关:在 Python 中使用 OpenCV 进行人脸检测。
Python OpenCV实现图像转换:图像反射
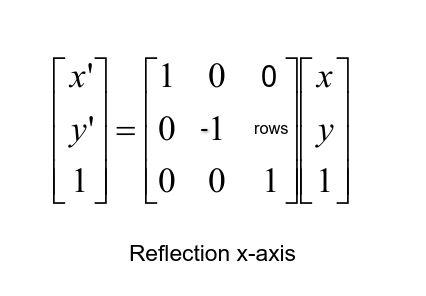
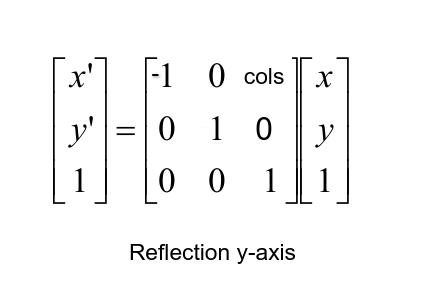
图像反射(或镜像)对于翻转图像很有用,它可以垂直和水平翻转图像,这是缩放的一种特殊情况。对于沿 x 轴的反射,我们将Sy的值设置为 -1,将Sx的值设置为 1,对于 y 轴反射,反之亦然。
反射的变换矩阵如下所示:
 这是用于反射的 Python 代码:
import numpy as np
import cv2
import matplotlib.pyplot as plt

# read the input image
img = cv2.imread("city.jpg")
# convert from BGR to RGB so we can plot using matplotlib
img = cv2.cvtColor(img, cv2.COLOR_BGR2RGB)
# disable x & y axis
plt.axis('off')
# show the image
plt.imshow(img)
plt.show()
# get the image shape
rows, cols, dim = img.shape
# transformation matrix for x-axis reflection
M = np.float32([[1,  0, 0   ],
                [0, -1, rows],
                [0,  0, 1   ]])
# transformation matrix for y-axis reflection
# M = np.float32([[-1, 0, cols],
#                 [ 0, 1, 0   ],
#                 [ 0, 0, 1   ]])
# apply a perspective transformation to the image
reflected_img = cv2.warpPerspective(img,M,(int(cols),int(rows)))
# disable x & y axis
plt.axis('off')
# show the resulting image
plt.imshow(reflected_img)
plt.show()
# save the resulting image to disk
plt.imsave("city_reflected.jpg", reflected_img)
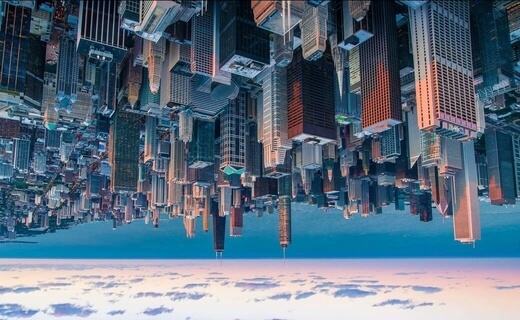
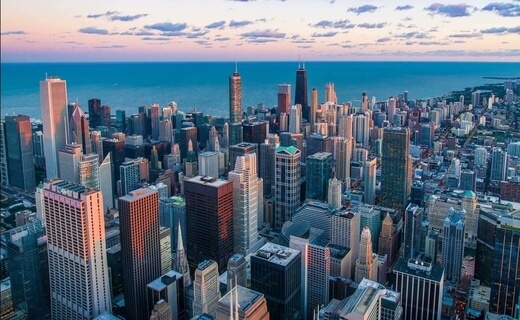
如前所述,这将反映它的 x 轴,如果你想要 y 轴反射,请取消注释第二个矩阵并注释第一个矩阵。
X轴反射图像:
Y轴反射图像:
 Python图像转换示例:图像旋转
旋转是数学中的一个概念,它是某个空间的运动,它至少保留一个点。图像旋转是一种常见的图像处理程序,应用于匹配、对齐和其他基于图像的算法,它也 广泛用于数据增强,尤其是 在图像分类方面。
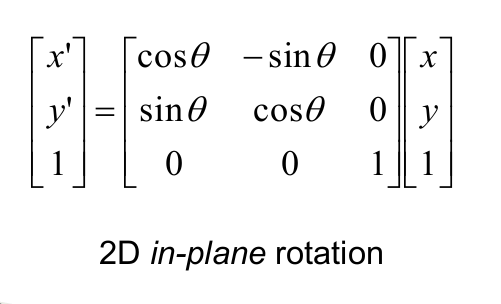
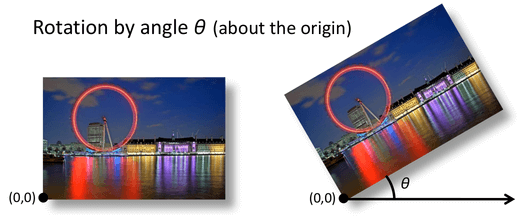 旋转变换矩阵如下图所示,其中 theta ( θ ) 为旋转角度:
 下面是图像旋转的 Python 代码:
import numpy as np
import cv2
import matplotlib.pyplot as plt

# read the input image
img = cv2.imread("city.jpg")
# convert from BGR to RGB so we can plot using matplotlib
img = cv2.cvtColor(img, cv2.COLOR_BGR2RGB)
# disable x & y axis
plt.axis('off')
# show the image
plt.imshow(img)
plt.show()
# get the image shape
rows, cols, dim = img.shape
#angle from degree to radian
angle = np.radians(10)
#transformation matrix for Rotation
M = np.float32([[np.cos(angle), -(np.sin(angle)), 0],
            	[np.sin(angle), np.cos(angle), 0],
            	[0, 0, 1]])
# apply a perspective transformation to the image
rotated_img = cv2.warpPerspective(img, M, (int(cols),int(rows)))
# disable x & y axis
plt.axis('off')
# show the resulting image
plt.imshow(rotated_img)
plt.show()
# save the resulting image to disk
plt.imsave("city_rotated.jpg", rotated_img)
输出图像:
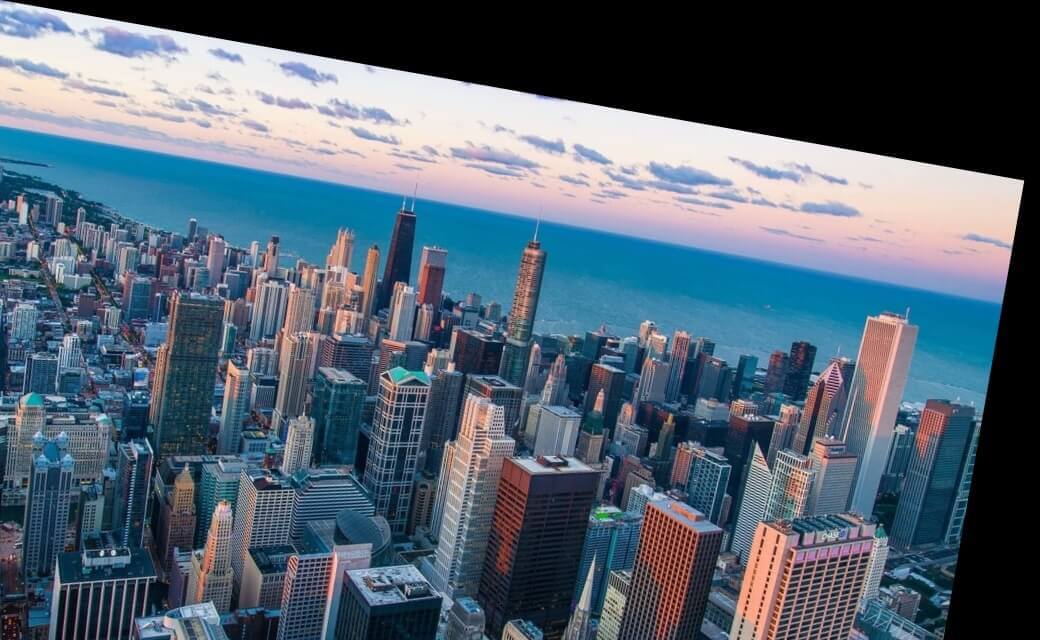 这是旋转了 10° (
 np.radians(10)),你可以随意编辑它!
相关:如何使用 OpenCV 在 Python 中执行边缘检测。
Python图像转换示例:图像裁剪
Python如何实现图像转换?图像裁剪是从图像中去除不需要的外部区域,上面的很多示例都引入了黑色像素,你可以使用裁剪轻松地去除它们。下面的代码是这样做的:
import numpy as np
import cv2
import matplotlib.pyplot as plt

# read the input image
img = cv2.imread("city.jpg")
# convert from BGR to RGB so we can plot using matplotlib
img = cv2.cvtColor(img, cv2.COLOR_BGR2RGB)
# disable x & y axis
plt.axis('off')
# show the image
plt.imshow(img)
plt.show()
# get 200 pixels from 100 to 300 on both x-axis & y-axis
# change that if you will, just make sure you don't exceed cols & rows
cropped_img = img[100:300, 100:300]
# disable x & y axis
plt.axis('off')
# show the resulting image
plt.imshow(cropped_img)
plt.show()
# save the resulting image to disk
plt.imsave("city_cropped.jpg", cropped_img)
Python OpenCV实现图像转换结果解释:由于 OpenCV 将图像加载为 numpy 数组,我们可以简单地通过索引数组来裁剪图像,在我们的例子中,我们选择在两个轴上从100到300获得200 个像素,这是输出图像:

结论
在本教程中,我们介绍了图像处理和变换的基础知识,即图像平移、缩放、剪切、反射、旋转和裁剪。
你可以在此处获取所有代码。

