Python如何实现混淆矩阵?在本教程中,你将看到 Python 中混淆矩阵的完整示例。
Python混淆矩阵教程包含的内容如下:
- 使用pandas创建混淆矩阵
- 使用seaborn显示混淆矩阵
- 通过pandas_ml获取额外的统计数据
- 处理非数字数据
使用 Pandas 在 Python 中创建混淆矩阵
首先,这是用于 Python 混淆矩阵的数据集:
| y_Current | y_Predicted |
| 1 | 1 |
| 0 | 1 |
| 0 | 0 |
| 1 | 1 |
| 0 | 0 |
| 1 | 1 |
| 0 | 1 |
| 0 | 0 |
| 1 | 1 |
| 0 | 0 |
| 1 | 0 |
| 0 | 0 |
然后,你可以通过使用以下代码创建 pandas DataFrame在 Python 中捕获此数据:
import pandas as pd

data = {'y_Actual':    [1, 0, 0, 1, 0, 1, 0, 0, 1, 0, 1, 0],
        'y_Predicted': [1, 1, 0, 1, 0, 1, 1, 0, 1, 0, 0, 0]
        }

df = pd.DataFrame(data, columns=['y_Actual','y_Predicted'])
print (df)
这是运行代码后数据的样子:
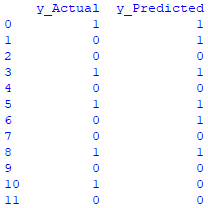
Python如何实现混淆矩阵?要使用pandas创建混淆矩阵,你需要按如下方式应用 pd.crosstab:
confusion_matrix = pd.crosstab(df['y_Actual'], df['y_Predicted'], rownames=['Actual'], colnames=['Predicted'])
print (confusion_matrix)这是创建混淆矩阵的完整Python混淆矩阵代码示例:
import pandas as pd

data = {'y_Actual':    [1, 0, 0, 1, 0, 1, 0, 0, 1, 0, 1, 0],
        'y_Predicted': [1, 1, 0, 1, 0, 1, 1, 0, 1, 0, 0, 0]
        }

df = pd.DataFrame(data, columns=['y_Actual','y_Predicted'])

confusion_matrix = pd.crosstab(df['y_Actual'], df['y_Predicted'], rownames=['Actual'], colnames=['Predicted'])
print (confusion_matrix)
运行代码,你会得到以下矩阵:

Python混淆矩阵教程 - 使用 seaborn显示混淆矩阵
你在上一节中刚刚创建的矩阵相当基本。
Python混淆矩阵示例:你可以使用Python 中的seaborn包来更生动地显示矩阵。要完成此任务,你需要将以下两个组件添加到代码中:
- 将 seaborn 导入为 sn
- sn.heatmap(confusion_matrix, annot=True)
你还需要使用matplotlib包通过添加以下内容来绘制结果:
- 导入 matplotlib.pyplot 作为 plt
- plt.show()
把所有东西放在一起:
import pandas as pd
import seaborn as sn
import matplotlib.pyplot as plt

data = {'y_Actual':    [1, 0, 0, 1, 0, 1, 0, 0, 1, 0, 1, 0],
        'y_Predicted': [1, 1, 0, 1, 0, 1, 1, 0, 1, 0, 0, 0]
        }

df = pd.DataFrame(data, columns=['y_Actual','y_Predicted'])
confusion_matrix = pd.crosstab(df['y_Actual'], df['y_Predicted'], rownames=['Actual'], colnames=['Predicted'])

sn.heatmap(confusion_matrix, annot=True)
plt.show()
这是你将获得的显示:
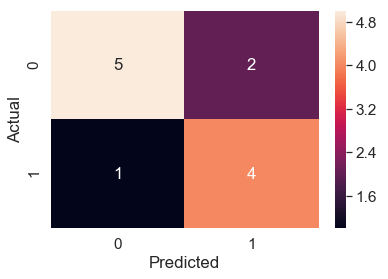
好多了!
或者,你还可以通过设置margins = True在混淆矩阵的边缘添加总数。
所以你的 Python 代码看起来像这样:
import pandas as pd
import seaborn as sn
import matplotlib.pyplot as plt

data = {'y_Actual':    [1, 0, 0, 1, 0, 1, 0, 0, 1, 0, 1, 0],
        'y_Predicted': [1, 1, 0, 1, 0, 1, 1, 0, 1, 0, 0, 0]
        }

df = pd.DataFrame(data, columns=['y_Actual','y_Predicted'])
confusion_matrix = pd.crosstab(df['y_Actual'], df['y_Predicted'], rownames=['Actual'], colnames=['Predicted'], margins = True)

sn.heatmap(confusion_matrix, annot=True)
plt.show()
运行代码,你将获得以下带有总数的混淆矩阵:
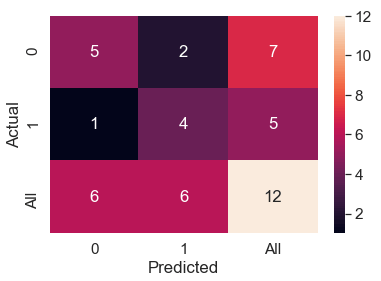
Python混淆矩阵示例:使用 pandas_ml 获取额外的统计信息
你可以使用 Python 中的 pandas_ml 包打印其他统计信息(例如 Accuracy)。你可以使用PIP安装 pandas_ml 包:
pip install pandas_ml然后,你需要将以下语法添加到代码中:
Confusion_Matrix = ConfusionMatrix(df['y_Actual'], df['y_Predicted'])
Confusion_Matrix.print_stats()以下是可用于获取其他统计信息的完整Python混淆矩阵代码示例:
import pandas as pd
from pandas_ml import ConfusionMatrix

data = {'y_Actual':    [1, 0, 0, 1, 0, 1, 0, 0, 1, 0, 1, 0],
        'y_Predicted': [1, 1, 0, 1, 0, 1, 1, 0, 1, 0, 0, 0]
        }

df = pd.DataFrame(data, columns=['y_Actual','y_Predicted'])
Confusion_Matrix = ConfusionMatrix(df['y_Actual'], df['y_Predicted'])
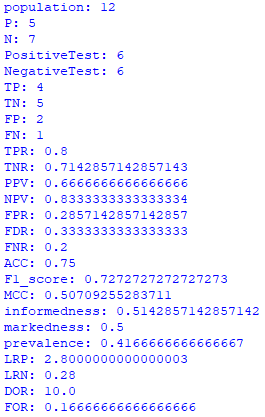
Confusion_Matrix.print_stats()运行代码,你会看到下面的测量结果(注意,如果你在运行代码时遇到错误,你可以考虑更改 pandas 的版本。例如,你可以将 pandas 的版本更改为 0.23。 4 使用此命令:pip install pandas==0.23.4):
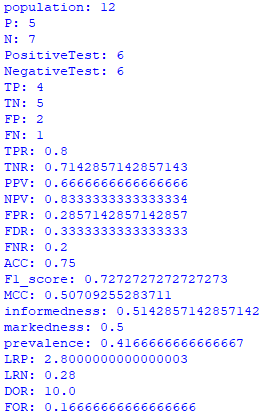
对于我们的例子:
- TP = True Positives = 4
- TN = True Negatives = 5
- FP = False Positives = 2
- FN = False Negatives = 1
你还可以直接从混淆矩阵中观察 TP、TN、FP 和 FN:
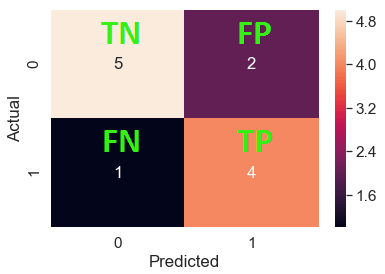
对于一个人口12,精度:
准确率 = (TP+TN)/人口= (4+5)/12 = 0.75
Python如何实现混淆矩阵?处理非数字数据
到目前为止,你已经了解了如何使用数字数据创建混淆矩阵。但是如果你的数据是非数字的呢?
例如,如果你的数据包含非数字值,例如“是”和“否”(而不是“1”和“0”),该怎么办?
在这种情况下:
- YES = 1
- NO = 0
所以数据集看起来像这样:
| y_Actual | y_Predicted |
| Yes | Yes |
| No | Yes |
| No | No |
| Yes | Yes |
| No | No |
| Yes | Yes |
| No | Yes |
| No | No |
| Yes | Yes |
| No | No |
| Yes | No |
| No | No |
然后,你可以应用简单的映射练习将“是”映射到 1,将“否”映射到 0。
Python混淆矩阵示例:具体来说,你需要将以下部分添加到代码中:
df ['y_Current'] = df ['y_Current'].map ({'Yes': 1, 'No': 0})
df['y_Predicted'] = df['y_Predicted'].map({'Yes': 1, 'No': 0})
这就是完整的Python混淆矩阵代码示例的样子:
import pandas as pd
from pandas_ml import ConfusionMatrix

data = {'y_Actual':    ['Yes', 'No',  'No', 'Yes', 'No', 'Yes', 'No',  'No', 'Yes', 'No', 'Yes', 'No'],
        'y_Predicted': ['Yes', 'Yes', 'No', 'Yes', 'No', 'Yes', 'Yes', 'No', 'Yes', 'No', 'No',  'No']
        }

df = pd.DataFrame(data, columns=['y_Actual','y_Predicted'])
df['y_Actual'] = df['y_Actual'].map({'Yes': 1, 'No': 0})
df['y_Predicted'] = df['y_Predicted'].map({'Yes': 1, 'No': 0})

Confusion_Matrix = ConfusionMatrix(df['y_Actual'], df['y_Predicted'])
Confusion_Matrix.print_stats()
然后你会得到相同的统计数据:
以上就是Python混淆矩阵教程的全部内容,希望这些例子可以帮助到你,谢谢阅读。

