
主成分分析(PCA)是一种使用正交变换的统计过程, 该正交变换将一组相关变量转换为一组不相关变量。 PCA是探索性数据分析和预测模型的机器学习中使用最广泛的工具。此外, PCA是一种无监督的统计技术, 用于检查一组变量之间的相互关系。这也称为一般因素分析, 其中回归确定一条最佳拟合线。
所需模块:
import pandas as pd
import numpy as np
import matplotlib.pyplot as plt
import seaborn as sns
% matplotlib inline
代码1:
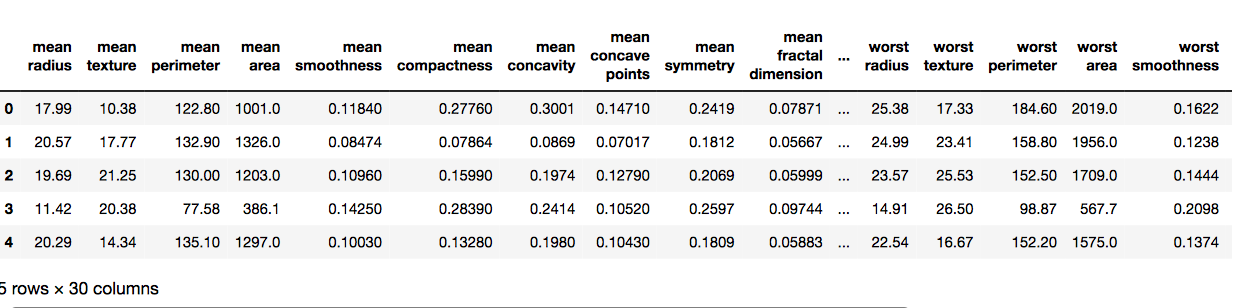
# Here we are using inbuilt dataset of scikit learn
from sklearn.datasets import load_breast_cancer

# instantiating
cancer = load_breast_cancer()

# creating dataframe
df = pd.DataFrame(cancer[ 'data' ], columns = cancer[ 'feature_names' ])

# checking head of dataframe
df.head()
输出如下:
代码2:
# Importing standardscalar module
from sklearn.preprocessing import StandardScaler

scalar = StandardScaler()

# fitting
scalar.fit(df)
scaled_data = scalar.transform(df)

# Importing PCA
from sklearn.decomposition import PCA

# Let's say, components = 2
pca = PCA(n_components = 2 )
pca.fit(scaled_data)
x_pca = pca.transform(scaled_data)

x_pca.shape
输出如下:
#减少至569, 2

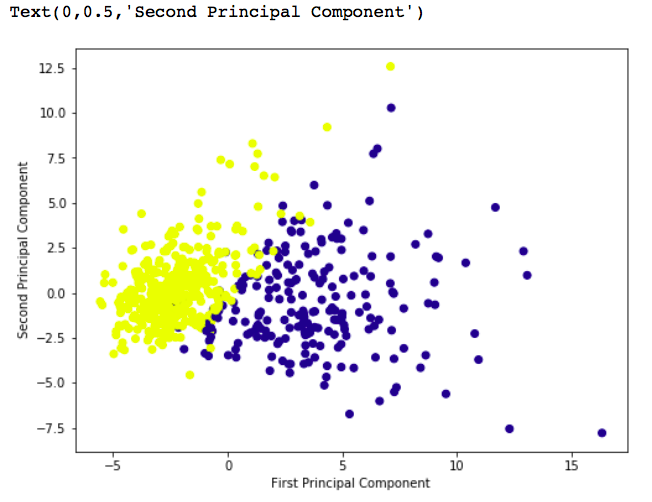
# giving a larger plot
plt.figure(figsize = ( 8 , 6 ))

plt.scatter(x_pca[:, 0 ], x_pca[:, 1 ], c = cancer[ 'target' ], cmap = 'plasma' )

# labeling x and y axes
plt.xlabel( 'First Principal Component' )
plt.ylabel( 'Second Principal Component' )
输出如下:
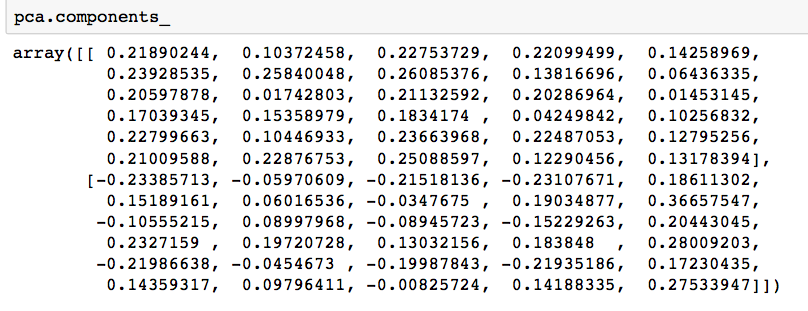
# components
pca.components_
输出如下:
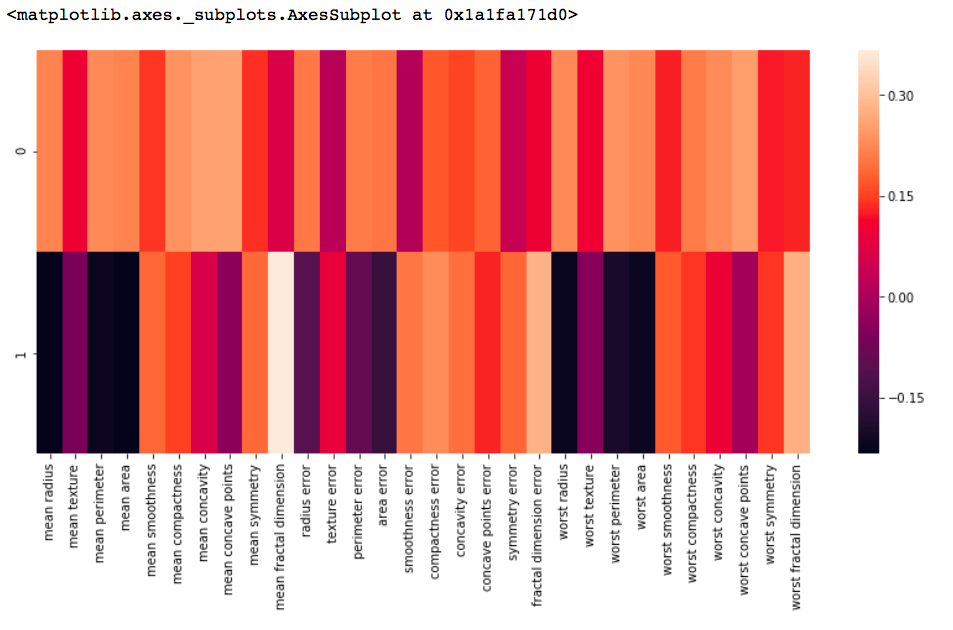
df_comp = pd.DataFrame(pca.components_, columns = cancer[ 'feature_names' ])

plt.figure(figsize = ( 14 , 6 ))

# plotting heatmap
sns.heatmap(df_comp)
输出如下:
![从字法上最小长度N的排列,使得对于正好为K个索引,a[i] a[i]+1](https://www.lsbin.com/wp-content/themes/begin%20lts/img/loading.png)
