
Violin Plot是一种可视化不同变量数值数据分布的方法。它类似于Box Plot, 但每侧都有旋转的图, 从而在y轴上提供了有关密度估计的更多信息。
将密度镜像并翻转, 然后填充最终的形状, 创建类似于小提琴的图像。Violin Plot的优势在于它可以显示出箱图中无法察觉的细微差别。另一方面, 箱线图更清楚地显示了数据中的异常值。
Violin Plot比box plot具有更多的信息, 它们不那么受欢迎。由于它们不受欢迎, 对于许多不熟悉Violin Plot表示形式的读者来说, 它们的含义可能更难理解。
要获取虹膜数据的链接, 请单击–这里:https://drive.google.com/open?id=1UJWvXXA5OygZa5cQg7N5xLfSxrXKg6An
有关数据集的属性信息:
Attribute Information:
   -> sepal length in cm
   -> sepal width in cm
   -> petal length in cm
   -> petal width in cm
   -> class:
              Iris Setosa
              Iris Versicolour
              Iris Virginica

Number of Instances: 150

Summary Statistics:
             Min  Max   Mean    SD   Class Correlation
   sepal length: 4.3  7.9   5.84  0.83    0.7826
    sepal width: 2.0  4.4   3.05  0.43   -0.4194
   petal length: 1.0  6.9   3.76  1.76    0.9490  (high!)
    petal width: 0.1  2.5   1.20  0.76    0.9565  (high!)

Class Distribution: 33.3% for each of 3 classes.
加载库
import numpy as np
import pandas as pd
import seaborn as sns
from matplotlib import pyplot
import seaborn
加载数据中
data = pd.read_csv( "Iris.csv" )
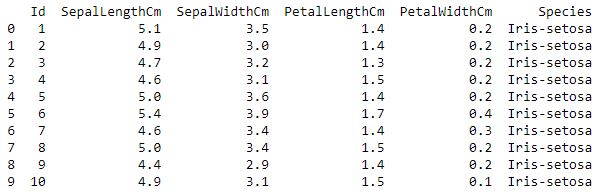
print (data.head( 10 ))输出如下:
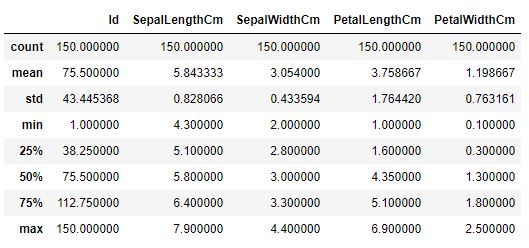
描述
data.describe()输出如下:
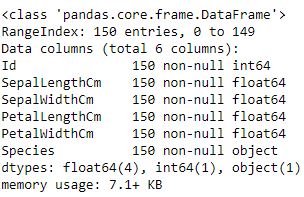
信息
data.info()输出如下:
描述虹膜数据集的" SepalLengthCm"参数。
data[ "SepalLengthCm" ].describe()输出如下:
count    150.000000
mean       5.843333
std        0.828066
min        4.300000
25%        5.100000
50%        5.800000
75%        6.400000
max        7.900000
Name: SepalLengthCm, dtype: float64
代码1:
" SepalLengthCm"参数的Violin Plot。
fig, ax = pyplot.subplots(figsize = ( 9 , 7 ))
sns.violinplot( ax = ax, y = data[ "SepalLengthCm" ] )
输出如下:
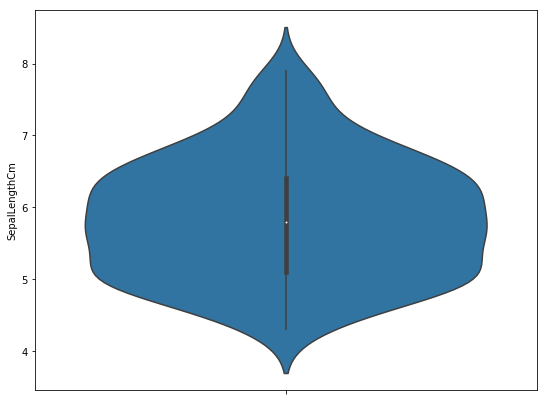
如你所见, 我们在5到6之间具有更高的密度。这非常重要, 因为正如SepalLengthCm描述中那样, 平均值为5.43。
代码2:" SepalLengthWidth"参数的Violin Plot。
fig, ax = pyplot.subplots(figsize = ( 9 , 7 ))
sns.violinplot(ax = ax, y = data[ "SepalWidthCm" ] )
输出如下:
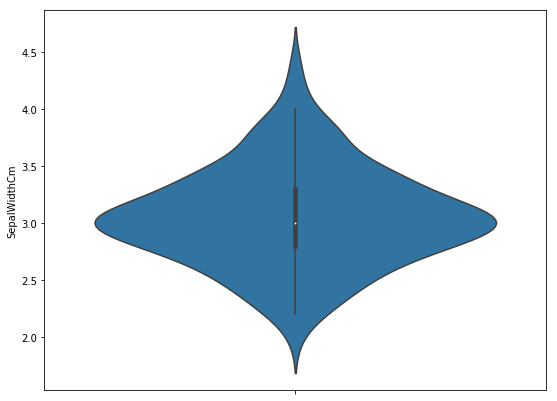
同样, 这里的更高密度是平均值= 3.05
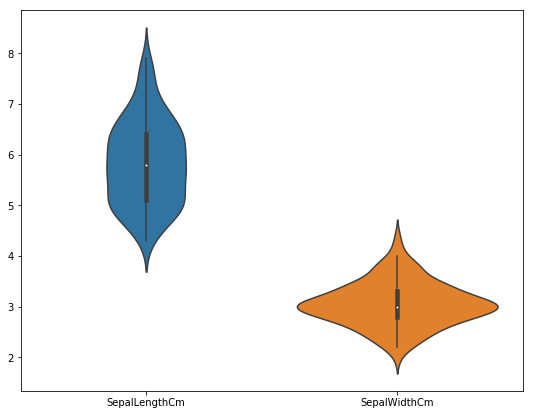
代码3:小提琴比较" SepalLengthCm"和" SepalWidthCm"的图。
fig, ax = pyplot.subplots(figsize = ( 9 , 7 ))
sns.violinplot(ax = ax, data = data.iloc[:, 1 : 3 ])
输出如下:
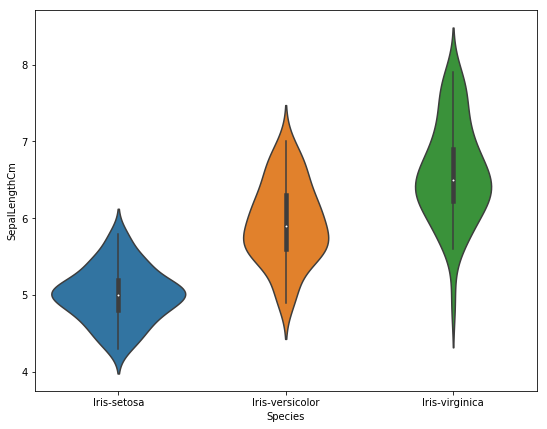
代码4:小提琴比较明智的" SepalLengthCm"种类。
fig, ax = pyplot.subplots(figsize = ( 9 , 7 ))
sns.violinplot(ax = ax, x = data[ "Species" ], y = data[ "SepalLengthCm" ] )
输出如下:
首先, 你的面试准备可通过以下方式增强你的数据结构概念:Python DS课程。

