
ggplot2也被称为图形语法,它是一个免费的、开源的、易于使用的可视化包,广泛应用于R中。它是Hadley Wickham编写的功能最强大的可视化包。
它包括对其进行管理的几层。图层如下:
图层的构建块
具有感兴趣变量的层如下:
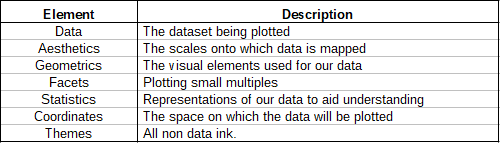
- Aesthetics美学:x轴, y轴, 颜色, 填充, 大小, 标签, alpha, 形状, 线宽, 线型
- Geometrics几何学:点, 线, 直方图, 条形图, 箱线图
- Facets构面:列, 行
- Statistics统计:分档, 平滑, 描述性, 中间
- Coordinates坐标:笛卡尔, 固定, 极点, 极限
- Themes主题:非数据链接
数据集
mtcars(汽车趋势汽车道路测试)包括油耗以及32辆汽车的10个方面的汽车设计和性能, 并预先安装了dplyr在R中打包。
# Installing the package
install.packages( "dplyr" )

# Loading package
library(dplyr)

# Summary of dataset in package
summary(mtcars)
在数据集上执行ggplot2
我们设计可视化mtcars包含32个汽车品牌和11个属性的数据集ggplot2层。
# Installing the package
install.packages( "ggplot2" )
# Loading packages
library(ggplot2)
library(dplyr)
# Data Layer
ggplot(data = mtcars)
# Aesthetic Layer
ggplot(data = mtcars, aes(x = hp, y = mpg, col = disp))
# Geometric layer
ggplot(data = mtcars, aes(x = hp, y = mpg, col = disp)) + geom_point()
# Adding size
ggplot(data = mtcars, aes(x = hp, y = mpg, size = disp)) + geom_point()
# Adding color and shape
ggplot(data = mtcars, aes(x = hp, y = mpg, col = factor(cyl), shape = factor(am))) + geom_point()
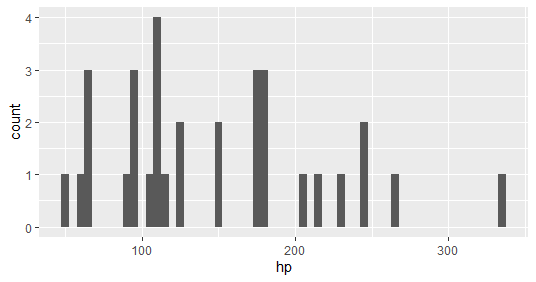
# Histogram plot
ggplot(data = mtcars, aes(x = hp)) +
geom_histogram(binwidth = 5 )
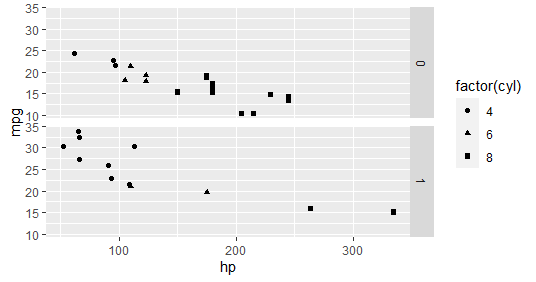
# Facet Layer
p < - ggplot(data = mtcars, aes(x = hp, y = mpg, shape = factor(cyl))) + geom_point()
# Separate rows according to transmission type
p + facet_grid(am ~ .)
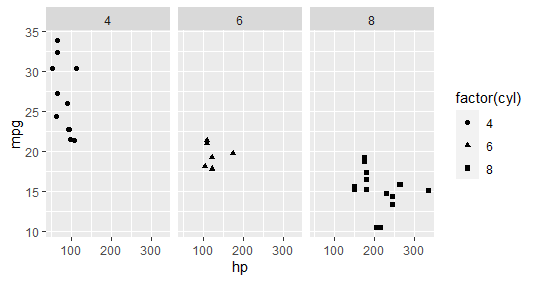
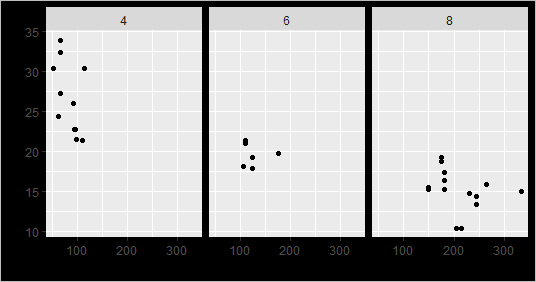
# Separate columns according to cylinders
p + facet_grid(. ~ cyl)
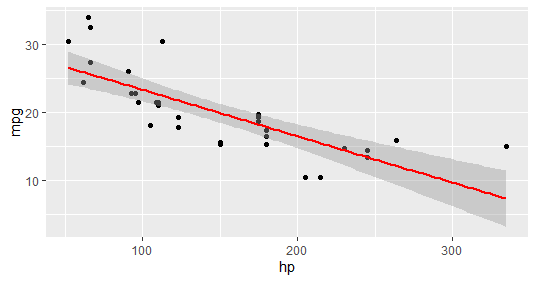
# Statistics layer
ggplot(data = mtcars, aes(x = hp, y = mpg)) +
geom_point() +
stat_smooth(method = lm, col = "red" )
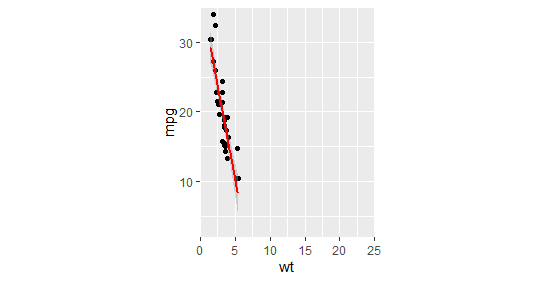
# Coordinates layer: Control plot dimensions
ggplot(data = mtcars, aes(x = wt, y = mpg)) +
geom_point() +
stat_smooth(method = lm, col = "red" ) +
scale_y_continuous( "mpg" , limits = c( 2 , 35 ), expand = c( 0 , 0 )) +
scale_x_continuous( "wt" , limits = c( 0 , 25 ), expand = c( 0 , 0 )) + coord_equal()
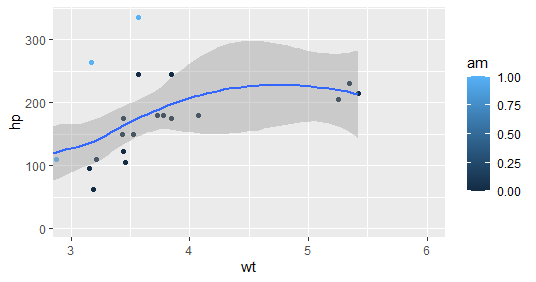
# Add coord_cartesian() to proper zoom in
ggplot(data = mtcars, aes(x = wt, y = hp, col = am)) +
geom_point() + geom_smooth() +
coord_cartesian(xlim = c( 3 , 6 ))
# Theme layer
ggplot(data = mtcars, aes(x = hp, y = mpg)) +
geom_point() + facet_grid(. ~ cyl) +
theme(plot.background = element_rect(
fill = "black" , colour = "gray" ))
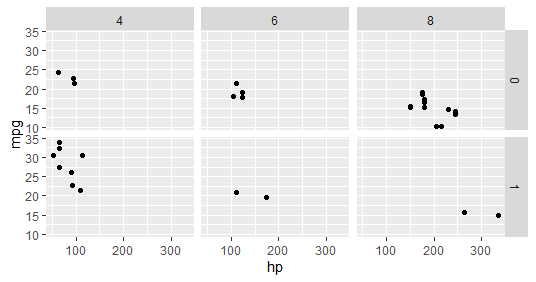
ggplot(data = mtcars, aes(x = hp, y = mpg)) +
geom_point() + facet_grid(am ~ cyl) +
theme_gray()输出如下:
几何层
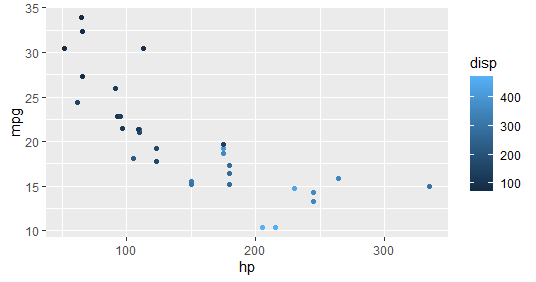
几何层-添加大小
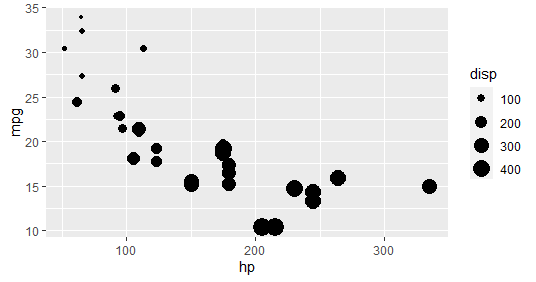
几何层–添加颜色和形状
几何层–直方图
构面层–根据传输类型分隔行
构面层–根据圆柱体分开的列
统计层
坐标层:控制图尺寸
Coord_cartesian()适当放大
主题层– element_rect()函数
主题层
ggplot2提供各种类型的可视化。可以在包中使用更多参数, 因为包可以更好地控制数据的可视化。许多软件包都可以与ggplot2软件包集成, 以使可视化具有交互性和动画效果。

